15 May 2013

SYBIS Demo: Implementing BI solutions using Agile/SCRUM methodology


I’ll be presenting at the next Sydney BI Social (SYBIS) group about how to implement a BI system using Agile methodology.

This demo will include some tips and techniques for using Agile in BI implementation and a case study of using TFS 2012 for ALM on a BI project.

You can find out more about this session on the following links:

http://www.meetup.com/SYBISGROUP/

https://www.linkedin.com/groups?gid=4900023

02 April 2013

Sydney BI Social Group (SYBIS)

Sydney BI Social (SYBIS) group is a new event for the Sydney business intelligence community. Organised by myself and James Beresford (www.bimonkey.com), this event will be held on the first Wednesday of each month.

The aim of this group is to provide an opportunity for Sydney BI professionals to get update on the market trends, share ideas and experiences, have a beer or two, and network with other practitioners and experts.

The format will be simple: topics will be suggested prior to the event and will be used to initiate discussions. We will try to have a panel of experts for each session that are experienced in that specific area. They will be sharing their knowledge and experience with the group. You are also welcome to talk about problems that you are facing in your real-life projects or certainly any solutions that you may have and want to share.

We may also have a challenge of some sort, it will be optional, so don't worry!


More details can be found in our LinkedIn group:
https://www.linkedin.com/groups?home=&gid=4900023

Please RSVP using our Meetup group:
http://www.meetup.com/SYBISGROUP

12 February 2013

Magic Quadrant for Business Intelligence and Analytics Platforms 2013


The emphasis from most of the market leaders is on Mobile BI, big data, and data discovery tools that are business-user-friendly. Next trend seems to be data-as-a-service which could significantly grow the market for BI and analytics platforms.

Read the full report here:

http://www.gartner.com/technology/reprints.do?id=1-1DYKLUU&ct=130206&st=sb

Source: Gartner (February 2013)

19 July 2012

SQL Server 2012 BI: The Good, The Bad, and The Ugly

Recently I implemented a BI solution for a client using SQL Server 2012 and wanted to share some thoughts on that.

Reporting Layer

The Microsoft BI presentation layer includes several reporting and analysis tools including: Reporting Services, Report Builder, Power View, Excel, PowerPivot (for Excel and SharePoint), Excel Services, PerformancePoint Services and Visio Services.

Many of these tools have overlapping capabilities that can easily confuse developers and designers at first glance. For instance for ad-hoc functionalities you can use Report Builder, Excel, PowerPivot or Power View.

Number of this tools are only available on SharePoint Enterprise Edition. So if you don’t already have it and don’t want to spend on this costly licence you will miss many of them such as: Power View, PowerPivot for SharePoint, Excel Services, PerformancePoint Services and Visio Services.

By introducing the 
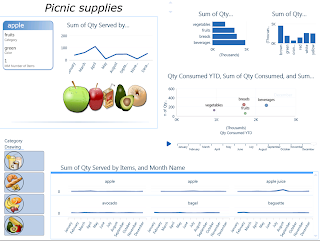
Power View, it seems like Microsoft was trying to add more self-service functionality to the stack, but to me this good looking and flashy tool won’t be able to compete with the beloved Excel to get adopted by business users, and it’s certainly not envisioned to be used by IT people either. The other big limitation is that only Tabular databases can be used as the source for Power View reports.


BI Layer

With the new Business Intelligence Semantic Model (BISM), the objective was to have one model for all user experiences: reporting, analytics, and custom applications, in other words “BI for all” based on the same model. Though a big difference is that in SQL Server 2012, Analysis Services is available in two types: Tabular and Multidimensional.

The Tabular model provides the advantage of the table-based approach, DAX queries, and the VertiPaq (xVelocity) which is an in-memory engine. In other words, a server version of PowerPivot without the need of SharePoint or Excel.

The Multidimensional model (cubes, dimensions & hierarchies) is what we had before with UDM, storing aggregated data on disk and using MDX language to query OLAP storage. It doesn’t have major changes since SQL 2008 except for a few fixes and optimizations and improvements.

The problem with that is unlike what Microsoft claimed, there is no such a thing as a unified BI model: BISM models cannot live together on the same SSAS instance and they speak in 2 different languages! Tabular database can be queried with old MDX too, but the point is developers spent so much time to understand and learn MDX (with not much luck!) and now they have to learn a new language and still keep learning the old one too!

Also there are not many tools that can use DAX to query database, currently Reporting Services and Excel 2010 can query the BISM tabular using MDX and PowerPivot and Power View can use DAX, so there is inconsistency in terms of the way you can talk to BISM, however Microsoft claims that this limitation would soon be removed and the developers could use either of the query languages to query data from both multidimensional or tabular types.

As Marco Russo stated in his blog "...there are opportunities in Tabular thanks to the flexibility, but these are very early days and we lack of new client tools able to take advantage of the new model. Power View is just one, but there is space for more."

Do I recommend using Tabular mode? Well, as it’s always the case: it depends. If you are implementing an enterprise BI solution, given the limitations of the Tabular mode I don’t recommend it at all, but if you don’t have a huge data size and you want to build a flexible system fairly quickly, then Tabular is the answer, otherwise use the traditional Mmltidimensional mode.

ETL and data Layer

SSIS had some improvements. Not only it looks nicer and tidier than previous versions, but also there are number of new controls and features in SSIS, such as Change Data Capture (CDC) tasks, scripting improvements and new expressions like LEFT, TOKEN and REPLACENULL, easier troubleshooting & logging, data taps, PowerShell support, etc. I was also very impressed with the data quality components in SSIS and DQS in general. 

Conclusion:

So in overall there are many new BI features and improvements in SQL Server 2012, but what seems to be lacked is a clear and well-defined vision on the BI roadmap. As mentioned, many of their tools are based on Enterprise Edition of SharePoint which is not affordable for small-mid size companies, and some of their tools are also not designed to satisfy enterprise clients. So to me it’s not very clear on where Microsoft is heading to and what type of market they are targeting with these products.


Update: Luke mentioned that Power View is now included as part of Excel 2013, I haven’t got chance to check it yet but am happy that Microsoft is coming to realize that not every company is interested in using SharePoint 2010 Enterprise, so perhaps they need to consider Office clients as the main delivery tool for BI and enrich the functionality of the good old friend Excel in order to have a better market share in BI space.

15 February 2012

Magic Quadrant for Business Intelligence Platforms 2012

As always, very informative report from Gartner analysing the BI vendors, tools and market. Highly recommended for anyone in BI world.


For me the highlights are:

Business vs. IT Driven BI. The conflict remains the same as before: business users demand easy to use, flexible products that put analytic power into their own hands, against IT's desire to maintain standards and create a supportable BI environment with predictable performance and quality data.

There are also other important features in this report, mostly around data discovery tools, Mobile BI, collaborative decision-making, new use cases and content types (real-time, big data, etc.), removing complexity, cloud services, predictive analytics, etc.

For more info:

http://www.gartner.com/DisplayDocument?doc_cd=225500&ref=g_sitelink

http://www.qlikview.com/mq2012

01 June 2011

Top tends in BI arena

I thought I’d share a few of my thoughts on the trends and technologies that are part of my daily life these days. From what I see in the market, the expectation from BI has changed significantly over the past few years. Now all size of companies are looking at investing in BI. They expect to spend less, get more ROI, more data accessibility, more insight into different levels of the business, more flexibility, and quicker response to the ever-changing business requirements.

Agile BI

Traditional waterfall design and development methodologies are too slow and too inflexible for BI. Many companies are now considering Agile for their BI implementations.
But don’t misinterpret what I am calling “Agile BI”, it’s not just about the Agile software development methodology, which is nothing new. IMHO Agile development by itself is not enough for BI, I think a different approach, technologies, and mindset are required to make BI more flexible
An agile software development process doesn't necessarily lead to agile BI, though it will speed up some steps in the process. The technology and processes (e.g. change management process) has to be made more flexible to really achieve agility.
Forrester defines Agile business intelligence as: An approach that combines processes, methodologies, organizational structure, tools, and technologies that enable strategic, tactical, and operational decision-makers to be more flexible and more responsive to the fast pace of changes to business and regulatory requirements.

Collaborative/social BI

Intelligence = Information + People

Collaboration and business intelligence have never been separated, but companies are just recently beginning to realize the benefits of the connection.

By introducing collaborative technologies to their business intelligence platform, companies are better positioned to utilize and take advantage of their employee data.

Collaboration is now becoming an essential part of the business intelligence. It enables crowdsourcing and in general the wisdom of the crowds tend to produce better decisions as organizations become increasingly complex.

Self-service BI

Let the business do it by themselves!
IT is always under one step behind from ever-changing business needs. The concept of self-service BI is to provide capabilities to enable business users exploring data and build their own reports. it may also enable analysts to publish and distribute their work to others.
Used in this way, the visual discovery tools become a nice tool for super users to create web-based reports and dashboards for colleagues. These reports are not static; they are “live” and interactive so casual users can analyse data just as business analysts would without the hassle of starting from scratch.

Predictive Analytics

"Predictive Analytics" is to analyse current and historical facts to make predictions about future events.

More and more vendors are attempting to make it more accessible to information workers and others without advanced degrees in statistics.
Data mining used to be mostly used by large enterprises (e.g. Banks) but these days I see companies in different sizes are started getting benefit from that.
There is also a trend in using social network data in data mining. It can be used to determine the trend, behaviour analysis and reduce customer churn.

18 October 2010

Project Phoenix - ANZ

Project Phoenix, started by SQL Server MVP Arnie Rowland, is a program which awards software, tools and training materials to under/unemployed developers who propose a software project for a non-profit agency, school or church.

More info: http://www.rodcolledge.com/rod_colledge/project-phoenix.html

28 September 2010

To PowerPivot, or not to PowerPivot?

We’ve all seen many presentations about PowerPivot and its great features like in-memory processing which enables Excel to handle millions of records. But the question is when to use PowerPivot as opposed to using a SSAS cube?
Here are some points you need to consider when choosing the tool:
Pros:
 
  • PowerPivot is a powerful tool to gather data from different data sources. It can be used to create POCs or demos in a quick (and possibly dirty) way.
  • It can be used to answer some ad-hoc questions or to play with data (data analysis).

Cons:
  • PowerPivot doesn't support data level security. Whoever gets access to the file can see all data inside it. With SSAS you can implement security at data level.
  • Complicated dimension types (like parent-child) are not supported in PowerPivot
  • Using PowerPivot workbooks as data source for reports may cause version management issues.
  • PowerPivot runs in memory, when you use PowerPivot for all your enterprise data you would need a huge RAM
  • Saving PowerPivot files in SharePoint may cause some issues when the size is too large.
  • SSAS allows you to fine tune your cube but with PowerPivot you can’t.
  • Data can easily be out of control as soon as it is saved on workstation. There also might be huge security risks involved. Even with the SharePoint implementation users have to download data to workstation first, and then publish it to SharePoint.
  • PowerPivot for SharePoint requires Enterprise license and SQL Server 2008R2 EE license. The cost (which is very high) may affect the SharePoint implementations of PowerPivot. By using PowerPivot without SharePoint (Excel add-in which is free) we may end up having even bigger Excel hell!
  • Source data is not always in high quality. We may need to validate and do data cleansing and also more often we need to apply some business rules which can be handled better in SSAS or at ETL level.
  • Working with data from different data sources may require high technical knowledge. Some data isn't that easy to join. A key isn't always available that lets you join data from different sources. It will make it hard for a non-technical person to work with the tool without any IT support.


From what I've seen so far, PowerPivot is not a replacement for Analysis Services, but it certainly has a role for tactical solutions. It also can be used by power users to quickly analyse data, or perhaps to build prototypes of larger scale SSAS implementations.

So I think PowerPivot is great for certain scenarios, but for Enterprise level data warehouse implementation SSAS is the way to go.

23 August 2010

New joy of my life...

This little man has delayed this blog for 4 months! Hopefully I’ll get more time to update this blog more often.

I started using SharePoint 2010 & SQL Server 2008 R2 in my new project and will share some thoughts on them very soon.

19 April 2010

SQL Server 2008 R2 - free ebook

You can download this free ebook from Microsoft Press to learn about new features of SQL Server 2008 R2.

Introducing Microsoft SQL Server 2008 R2, by Ross Mistry and Stacia Misner

Enjoy it!